STORYTELLING IN COGNOS ANALYTICS - IF DESIGN SUBMISSION
Storytelling in IBM Cognos Analytics allows business analysts to present their data to stakeholders in an interesting way, and also non-professional users to work with data in an intuitive and easy way.
This tool brings together these two types of users and allows them to engage with data in a way they never have before. By combining stories with real data, users have the tools of emotional engagement as well as tested facts at their disposal, allowing any message they are trying to communicate to be strengthened.
Storytelling at Cognos Analytics gives our users a truly unique capability and experience.

This tool can have a great impact in the field of business and data analytics. Our users are often experts working with hard facts and numbers that are difficult to communicate to their non-expert audience. The storytelling feature of Cognos Analytics expands on the world of data science, and makes it more relatable and applicable to a broader audience.
In addition, the tool is designed to be intuitive and easy to use so that they can create their story, and we are improving on it every day.
Our innovation lies in the interactive nature of our storytelling tool. Users no longer have to rely on static charts or images to tell their story. They can now engage with a live view of the data, allowing them to view data changes with different filters in real time. The users can pause their story if someone has questions and actually interact with the data by adding filters, highlighting data, ranking it, etc.
We also allow our users to animate their data. Users are able to highlight specific data while the visualization is playing, and draw attention and further engage their audience.
WHAT WE DO DIFFERENTLY
- Jennifer Aaker, Stanford Graduate School of Business
“Stories are up to 22 times more powerful than facts alone"
We ended up with a feature that is cross between a presentation tool and a video tool, including a simple timeline that allows the user to choose when visualizations appear on screen. Users can drag and drop data, shapes, images, and text to create their data narrative. The tool offers a bunch of prebuilt scene transitions so a user can have a simple slideshow or an infinite canvas for their data narrative. Our tool lets the audience feel like they are being immersed in the story that the data creates.

Users are able to add their live data in a presentation format using slides
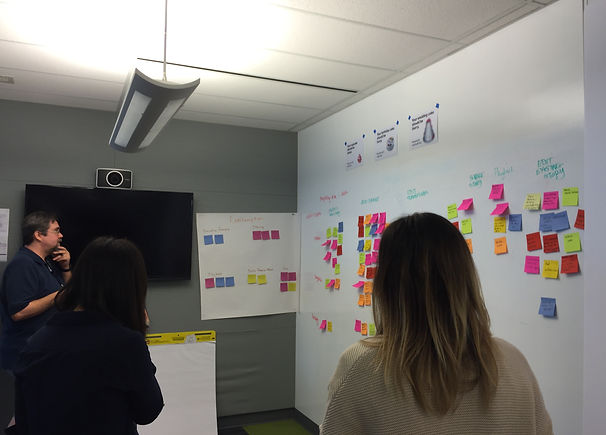
Throughout our process, we worked with a multidisciplinary team, including product management and front-end development in addition to our design work. This diverse team was crucial in helping us ensure that our work was viable, desirable, and feasible. We worked with this team to to identify pain points and areas for innovation with each major release. Endless sketches and designs went into building our features.
With precedent and a standard in mind, we began our process with the existing drag and drop feature in Cognos Analytics, where users are able to drag and drop their data into a visualization plane.
We built upon this feature to include shapes, images, and animations in the data visualization. This elevated the data presentation from simple visuals to visuals that were able to tell a narrative.
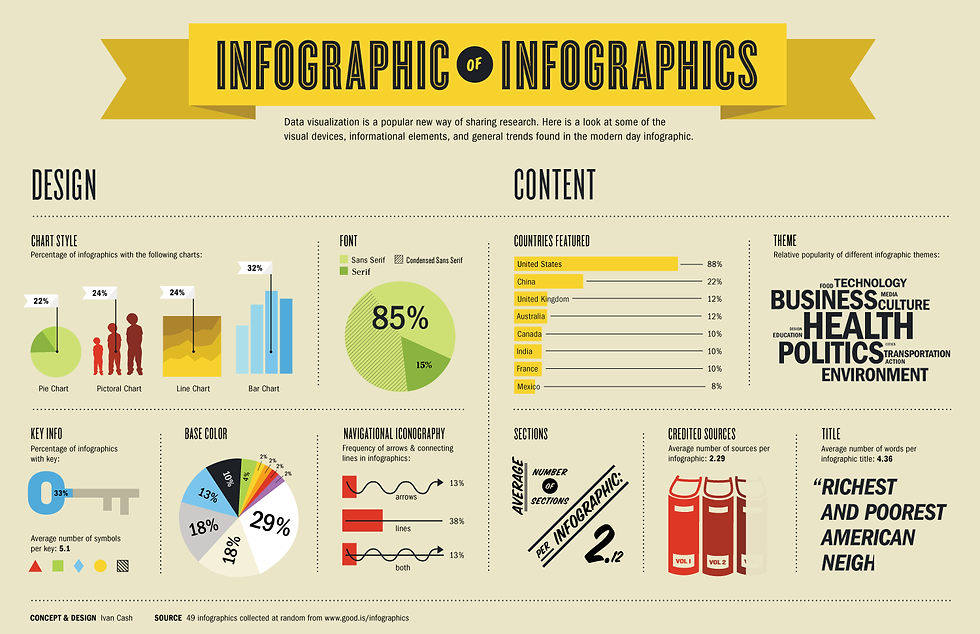
Source: Ivan Cash
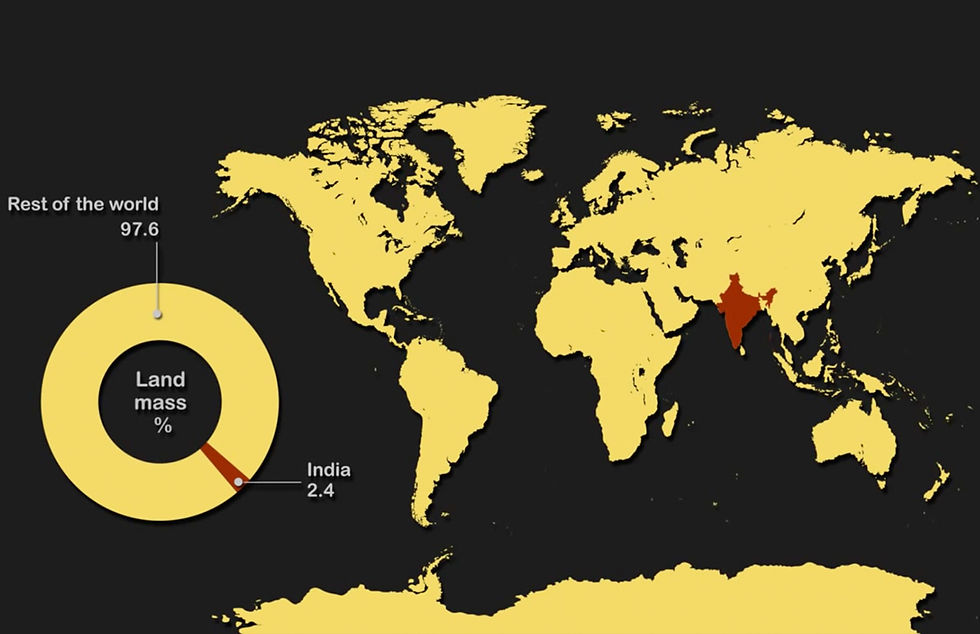
Source: The Economist
Our process began by conducting research on existing methods and tools. We looked into what kind of ways, such as images or videos, people were using to present their data and tell stories. Looking at these examples, we were able to set a standard for the presentations we would eventually create ourselves. Throughout our research we noticed that many of the existing visuals were made with professional photo and video editing tools, and all of the visuals were static.
PROCESS
STORYTELLING FOR IBM COGNOS ANALYTICS
When creating Storytelling for IBM Cognos Analytics, we foremost considered how can we help our users tell compelling stories with their data. With a user base of largely business analysts, we realized that our users are not professional story tellers, or at all accustomed to applying creativity when presenting their data. Our main challenge creating a tool for our users to easily build engaging, aesthetic stories with actual data.
- Stephen Few
“Numbers have an important story to tell. They rely on you to give them a clear and convincing voice.”
STORIES
Storytelling is one of the fundamental ways that humans communicate with each other. When a narrative is used to present data or facts to an audience, people are able to engage more with information that may otherwise be dry or not relatable.
Storytelling also allows data to be placed in a context, and doesn't leave the audience room for their own interpretations and conclusions, which may not be accurate. A context and a narrative allows people to really understand the picture that the data presents.
